A key point in Governor Newsom’s January 2020 State of the State address was his call to hold local governments accountable for housing production and for meeting state-determined housing needs. TPR shares the latest research from Embarcadero Institute finding that California’s most recent housing needs assessment was calculated using incorrect vacancy rates and double counting resulting in inflated numbers that obscure the state’s true need: funding for affordable housing. Arguing that the state’s approach to determining housing need must be defensible and reproducible if cities are to be held accountable for them, the report asserts that these inaccuracies (resulting in a 940,000 unit discrepancy) mask the fact that cities and counties are surpassing the state’s market-rate housing targets, but falling far short in meeting affordable housing targets.

Gab Layton, President, Embarcadero Institute
“The state’s exaggerated targets unfortunately mask the real story: Decades of overachieving in market-rate housing has not reduced housing costs for lower income households.”
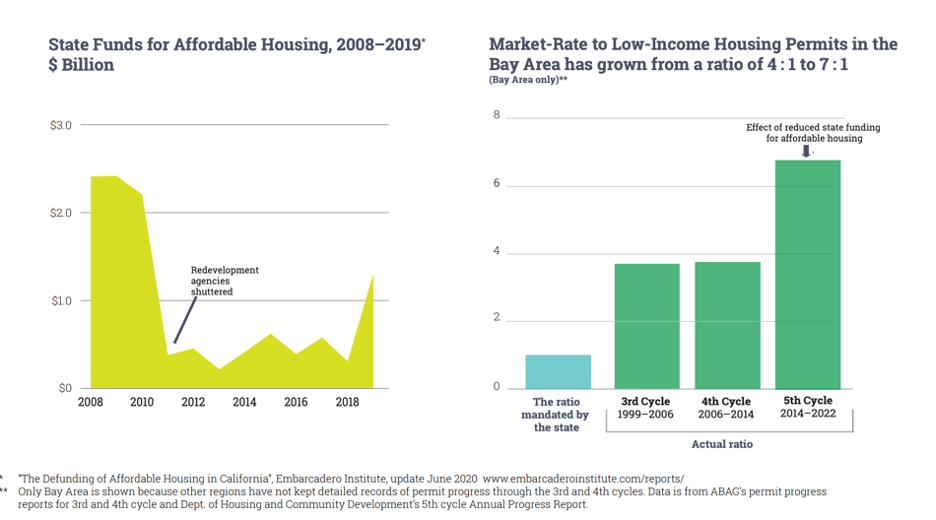
"California has been building four market-rate units for every one affordable unit for decades. And with the near-collapse of legislative funding for low-income housing in 2011, that ratio has grown to seven to eight market-rate units to each affordable unit...This worsening situation can’t be fixed by zoning or incentives which are the focus of many recent housing bills and only reinforce or worsen the ever-higher market-rate housing ratios.”
Do the Math: The state has ordered more than 350 cities to prepare the way for more than 2 million homes by 2030. But what if the math is wrong?
Senate Bill 828, co-sponsored by the Bay Area Council and Silicon Valley Leadership Group, and authored by state Sen. Scott Wiener in 2018, has inadvertently doubled the “Regional Housing Needs Assessment” in California.
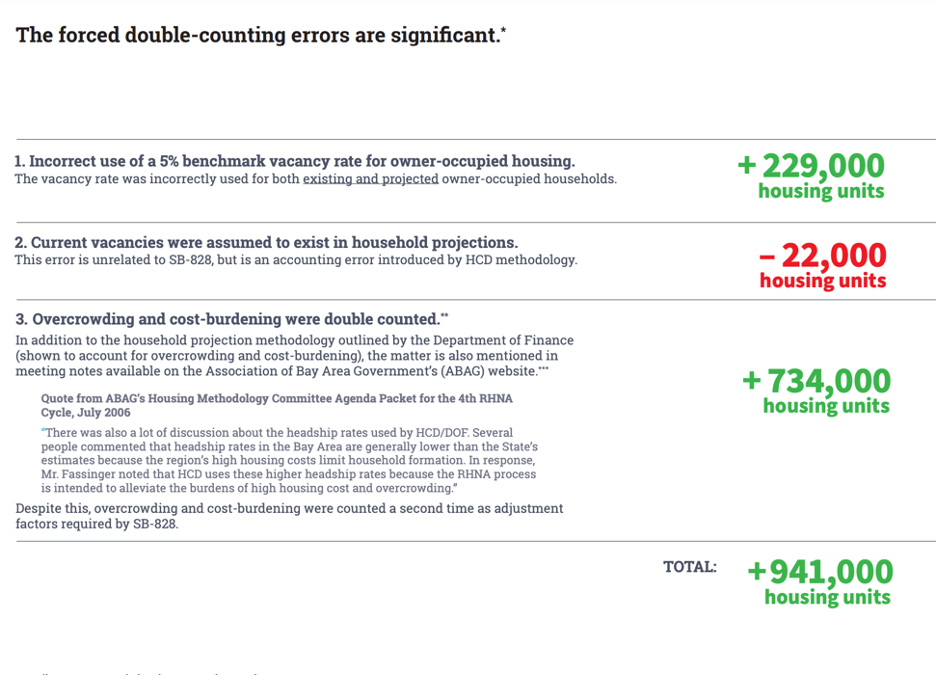
Use of an incorrect vacancy rate and double counting, inspired by SB-828, caused the state’s Department of Housing and Community Development (HCD) to exaggerate by more than 900,000 the units needed in SoCal, the Bay Area and the Sacramento area.
The state’s approach to determining the housing need must be defensible and reproducible if cities are to be held accountable. Inaccuracies on this scale mask the fact that cities and counties are surpassing the state’s market-rate housing targets, but falling far short in meeting affordable housing targets. The inaccuracies obscure the real problem and the associated solution to the housing crisis—the funding of affordable housing.
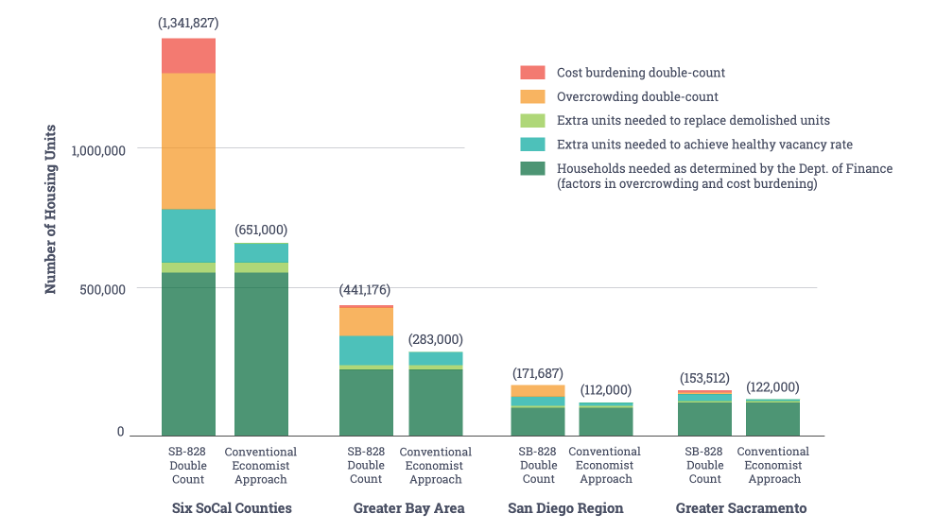
Double counting (not surprisingly) doubled the assessed housing need for the four major planning regions.
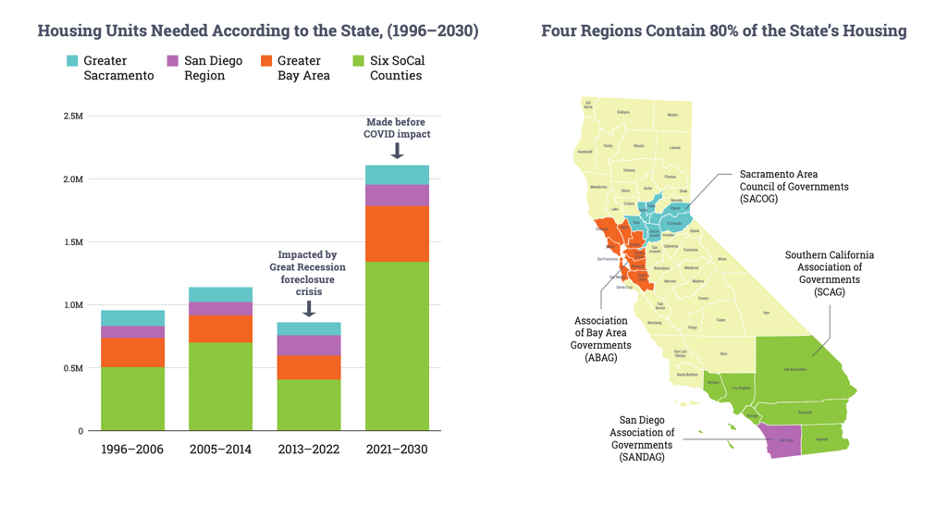
Every five to eight years the Department of Housing and Community Development (HCD) supervises and publishes the results of a process referred to as the Regional Housing Needs Assessment (RHNA). Four regional planning agencies cover the 21 most urban counties and account for 80% of California’s housing. All four regions saw a significant jump in the state’s assessment of their housing need for the years 2021 to 2030.
The double count, an unintended consequence of Senate Bill 828, has exaggerated the housing need by more than 900,000 units in the four regions below.
Senate Bill 828 was drafted absent a detailed understanding of the Department of Finance’s methodology for developing household forecasts, and absent an understanding of the difference between rental and home-owner vacancies. These misunderstandings have unwittingly ensured a series of double counts.
Mistaken Assumption: SB-828 wrongly assumed ‘existing housing need’ was not evaluated as part of California’s previous Regional Housing Need Assessments, or RHNA. There was an assumption that only future need had been taken into account in past assessments. (In fact, as detailed in The Reality section, the state’s existing housing need was fully evaluated in previous RHNA assessment cycles).
The Reality: Existing housing need has long been incorporated in California’s planning cycles. It has been evaluated by comparing existing vacancy rates with widely accepted benchmarks for healthy market vacancies (rental and owner-occupied). The difference between actual and benchmark is the measure of housing need/surplus in a housing market. Confusion about the inclusion of “existing need” may have arisen because vacancy rates at the time of the last assessment of housing need (”the 5th cycle”) were unusually high (higher than the healthy benchmarks) due to the foreclosure crisis of 2007–2010, and in fact, the vacancy rates suggested a surplus of housing. So, in the 5th cycle the vacancy adjustment had the effect of lowering the total housing need. Correctly seeing the foreclosure crisis as temporary, the state Department of Finance did not apply the full weight of the surplus, but instead assumed a percentage of the vacant housing would absorbed by the time the 5th cycle began. The adjustment appears in the 5th cycle determinations, not as ‘Existing Housing Need’ but rather as “Adjustment for Absorption of Existing Excess Vacant Units.”
Mistaken Assumption: SB-828 wrongly assumed a 5% vacancy rate in owner-occupied housing is healthy (as explained below, 5% vacancy in owner-occupied homes is never desirable, and contradicts Government Code 65584.01(b)(1)(E) which specifies that a 5% vacancy rate applies only to the rental housing market).
The Reality: While 5% is a healthy benchmark for rental vacancies, it is unhealthy for owner-occupied housing (which typically represents half of existing housing). Homeowner vacancy in the U.S. has hovered around 1.5% since the ‘70s, briefly reaching 3% during the foreclosure crisis. However, 5% is well outside any healthy norm, and thus does not appear on the Census chart (to the right) showing Annual Homeowner Vacancy Rates for the United States and Regions: 1968–2019.
Mistaken Assumption: SB-828 wrongly assumed overcrowding and cost-burdening had not been considered in Department of Finance projections of housing need. The bill sought to redress what it mistakenly thought had been left out by requiring regional planning agencies to report overcrowding and cost-burdening data to the Dept. of Housing and Community Development
The Reality: Unknown to the authors of SB-828, the Department of Finance (DOF) has for years factored overcrowding and cost-burdening into their household projections. These projections are developed by multiplying estimated population by the headship rate (the proportion of the population who will be head of a household). The Department of Finance (DOF) in conjunction with the Department of Housing and Community Development (HCD) has documented its deliberate decision to use higher headship rates to reflect optimal conditions and intentionally “alleviate the burdens of high housing cost and overcrowding.” Unfortunately, SB-828 has caused the state to double count these important numbers.
The state’s exaggerated targets unfortunately mask the real story: Decades of overachieving in market-rate housing has not reduced housing costs for lower income households.
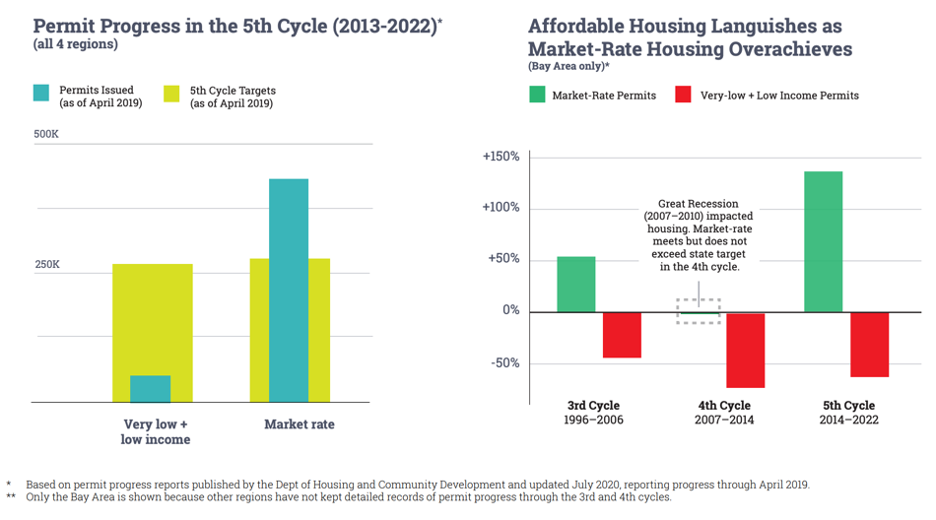
The state has shown, with decades of data, that it cannot dictate to the market. The market is going to take care of itself. The state’s responsibility is to take care of those left behind in the market’s wake. Based on housing permit progress reports published by the Dept. of Housing and Community Development in July 2020, cities and counties in the four most populous regions continue to strongly outperform on the state’s assigned market-rate housing targets, but fail to achieve even 20% of their low-income housing target. In the Bay Area where permit records have been kept since 1997, there is evidence that this housing permit imbalance has propagated through decades of housing cycles
It’s clear. Market-rate housing doesn’t need state incentives. Affordable housing needs state funding.
Cities are charged by the state to build one market-rate home for every one affordable home. But state laws, such as the density bonus law, incentivize developers to build market-rate units at a far higher rate than affordable units. As a result, California has been building four market-rate units for every one affordable unit for decades. And with the near-collapse of legislative funding for low-income housing in 2011, that ratio has grown to seven to eight market-rate units to each affordable unit. Yet we need one-to-one. This worsening situation can’t be fixed by zoning or incentives which are the focus of many recent housing bills and only reinforce or worsen the ever-higher market-rate housing ratios. From the data it appears that the shortage of housing resulted not from a failure by cities to issue housing permits, but rather a failure by the state to fund and support affordable housing. Future legislative efforts should take note.
Finally, since penalties are incurred for failing to reach state targets for housing permits, the methodology for developing these numbers must be transparent, rigorous and defensible. Non-performance in an income category triggers a streamlined approval process per Senate Bill 35 (2017). These exaggerated 6th cycle targets will make it impossible for cities and counties to attain even their market-rate targets, ensuring market-rate housing will qualify for incentives and bonuses meant for low income housing. Yet again low-income housing will lose out. The state needs to correct the errors in the latest housing assessment, and settle on a consistent, defensible approach going forward.
At Least Four Different Methodologies Have Forecast 2030 Housing Need for the Four Regions Been Used Simultaneously by the State to Discuss Housing Need: We Only Need One
1. The Conventional Economist Approach: uses goldilocks (not too big, not too small, just right) benchmarks for vacancies - 1.5% for owner-occupied and 5% for rental housing.
2. SB-828 Double Count: incorrectly uses a benchmark of 5% vacancy for owner-occupied housing. It also double counts overcrowding and cost-burdening
3. McKinsey’s New York Benchmark: the over-simplified approach generated an exaggerated housing gap of 3.5 Million for California. McKinsey multiplied California’s population by New York’s housing per capita to get 3.5M. New York is not a proper benchmark for California and NY’s higher housing per capita is more reflective of NY’s declining population rather than a healthy benchmark for housing
4. Jobs-to-housing ratio of 1.5: according to state planning agencies 1.5 is the optimal benchmark. Employment in the four regions is estimated to grow to 17 million by 2030 (job growth estimates prepared before COVID).**
- Log in to post comments


