

With the recent relief spending to aid California residents affected by the COVID-19 pandemic, state legislators scramble to find solutions to provide aid while avoiding budget cratering. TPR republishes here, with permission, the Los Angeles Coalition’s “Insight on LA” that breaks down California’s budget and income tax system, as well as provides changes necessary to safeguard economic development by broadening the state’s tax base. The LA Coalition report also shares the reaction of top earners in the state to tax reforms introduced in the last two decades.

Michael Kelly
"CA’s tax system is still based on an era in which goods, not services, dominated the economy. Numerous reports have detailed recommendations for a framework relying less on the highly volatile income taxes generated by high income earners and more on a broader based system."
Big Picture
The current state budget of CA is $203B, comprised of the general fund ($133B), special funds ($63.4B) and bond funds ($6.04B).
Seventy-five percent of the budget goes to "local assistance" programs that include schools (39% of GF goes to K-12), community colleges, CalWORKS families, Medi-Cal doctors, child care providers, and others.
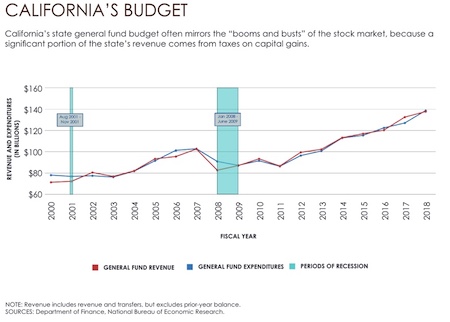
To help pay for these programs, almost 17 million Californians send, in the form of a personal income tax, a portion of their annual earnings to the state. These taxes account for nearly 70% of the state's General Fund revenue. This is an increase from just over 40% in 2010 due to the passage of Proposition 30 in 2012 that raised income tax rates for the highest earners (and Proposition 55 in 2016 that extended the tax increase to 2030).
A growing share of this revenue, 66.6% in 2016, was generated by the top 5% of CA's tax paying population, and by 2018, 40% was generated by the top .5%. The budget chart above reflects this revenue growth, but more importantly, it highlights state government's increasing role in funding the needs of a population of almost 40 million residents.
One estimate based on June 2017 numbers shows that CA’s total state and local government debt totaled just over $1.5 trillion. That total includes all outstanding bonds, loans, and other long-term liabilities, along with the officially reported unfunded liability for other post-employment benefits (primarily retiree healthcare), as well as unfunded pension liabilities.
The pandemic's impact on the economy, jobs and residents and the state's wildfires have only added to this debt. In the spring, the state was faced with a $54.3 billion state budget deficit and the projected drop in state tax revenue may be as much as $32 billion next year. The state held off on drastic cuts with an expectation that the federal government will send more dollars to state and local governments, which remains in limbo as the U.S. Senate takes a vacation.
Top Democratic lawmakers are also pushing a $100 billion stimulus plan that would provide extra unemployment benefits, expand tax credits for low-income and undocumented workers, protect renters from evictions, and help struggling landlords and small businesses, while also creating environmentally friendly jobs.
A number of CA's democratic legislators see a few solutions to address these funding needs, knowing that they have tapped out the more regressive forms of taxation, such as the sky-high sales tax, on their constituents. Three proposals:
- Increasing the state’s top 13.3% income tax rate to 16.8% to generate an estimated $6.5 billion in annual revenue from 70,000 Californians. (Tabled for now)
- Adding a new .4% wealth tax on all net worth above $30 million to generate an estimated $7.5 billion annually from 30,400 Californians. (Tabled for now)
- Backing Proposition 15, with the support of unions and teachers, on the November 2020 ballot that will ask voters to repeal the local tax cap for commercial properties like office buildings to generate an estimated $12 billion annually for schools.
These proposals are part of a national trend where some U.S. states have adopted “millionaire taxes” to generate revenue to mitigate inequality and improve economic opportunity, while some other U.S. state's promote their no income tax levy. Nine states have passed millionaire taxes and nine states have no state income tax at all. (Little know fact: CA's middle‐class workers -those who earn more than $57,000 - pay a top rate of 9.3 percent, which is higher than what millionaires pay in 47 states.)
For the past few years, researchers have been looking over CA's data to determine if the gradual increase of the state's personal income tax rate has contributed to millionaire tax flight – the richest residents looking to avoid the millionaire tax by moving to a different state.
Some data suggest this is the case. In 2018, the state lost $8 billion in adjusted gross income to other states, up from $135 million in 2012, according to IRS data. Some beneficiaries of this migration have been Nevada which gained $5.67 billion in new income, Arizona $4.96 billion and Texas $4.07 billion.
Some data out of Stanford and the CA Franchise Tax Board also suggests the strength of CA. The state's millionaire population grew from 15,000 in 1990 to more than 150,000 in 2007, and nearly 200,000 in 2014. And none of the tax changes some researchers studied shows a visually-perceptible effect on the general upward trend in the number of millionaires filing taxes in CA.
After the 2004 MHST came into effect, the number of millionaires continued to rise for three years, falling only during the 2008 financial crisis. This pattern does not indicate that the recent tax changes were of major concern to top-income earners.
I have highlighted more key findings below, but one must remember this was pre-COVID and the onset of more and more companies allowing their skilled and well compensated workers to work outside the office and/or state, may only further complicate CA's economic outlook.
CA’s Income Tax
-
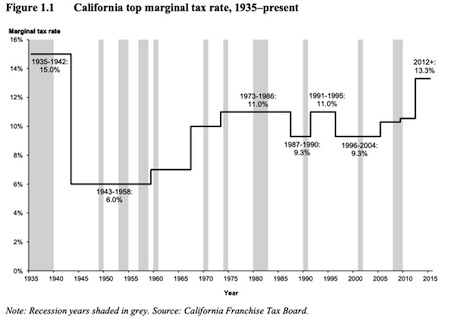
In 1935, CA’s personal income tax was established and since then the top marginal rate has changed 9 times, with 6 increases and 3 cuts. The top tax rate has ranged between 6 percent and 15 percent.
-
After a very large tax cut in 1942, the longterm trend has been towards higher top tax rates in the state.
-
Since 1973, the top rate has fluctuated between 9.3 percent and 13.3 percent.
-
During the 1990s incomes (e.g., salaries, bonuses, capital gains realizations, the exercise of stock options) of the top 20 percent of the state's earners (>$95,000 in 1998) jumped by an inflation‐adjusted 75 percent between 1980 and 1998. The legislature repealed the 10 and 11 percent brackets starting in tax year 1996, leaving 9.3% as the top rate.
-
In 2004, the Mental Health Services Tax added a new top bracket of 10.3 percent of income above $1,000,000.
-
In 2012, a state ballot initiative raised California's top individual income tax rate to 13.3 percent ‐‐ the highest in the nation.
-
In 2020 a handful of legislators proposed an increase CA’s personal income tax rate to 16.8% to generate an estimated $6.8 billion in new revenue a year. More specifically, the Assembly bill proposed raising the top rate to 14.3% for households making more than $1 million, 16.3% on income above $2 million and 16.8% above $5 million.
The 1%’s General Fund
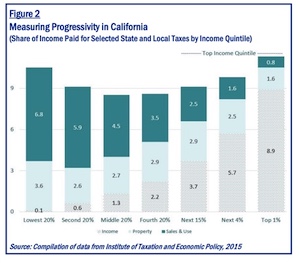
CA has among the highest income tax rates for upper-income households and one of the lowest income tax rates for lower-income households.
-
Taxes on top earners have an increasingly outsized effect on public revenues.
-
Perspective - In 1975, the sales tax (a regressive tax) was the state of California’s largest source of revenue, generating almost 50% of the state total.
-
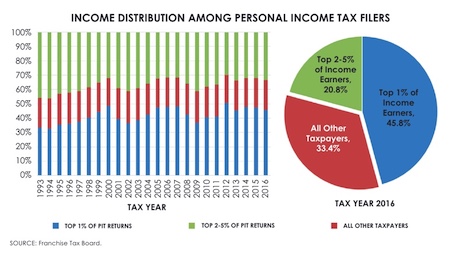
In 1993, the 1% of income earners were paying 33% of the state’s personal income tax.
-
By 2006, the 1% of income earners were paying 48% of the state's personal income tax.
-
In 2012 the 1% of income earners paid 50% of income taxes.
-
In 2016, the top 5% of earners paid 66.6 percent of the personal income tax.
-
In 2017, the top 1% of income taxpayers in California accounted for over 47% of income tax revenue.
-
By 2018 the 0.5% of earners were paying 40% of the state’s income-tax revenue - $32 billion in that year.
-
Today, the top 0.4% of taxpayers account for 40% of the dollars that come in from the state’s personal income tax.
CA’s Millionaires
Most people who earn $1 million or more are having an unusually good year. Income for these individuals was notably lower in years past and will decline for most in future years as well.
A representative “millionaire” will only have a handful of years in the $1 million+ tax bracket. The somewhat temporary nature of very-high earnings is one reason
Data out of Stanford and the CA Franchise Tax Board shows:
-
The state's millionaire population grew from 15,000 in 1990 to more than 150,000 in 2007, and nearly 200,000 in 2014.
-
None of the tax changes some researchers studied shows a visually-perceptible effect on the general upward trend in the number of millionaires filing taxes in CA.
-
After the 2004 MHST came into effect, the number of millionaires continued to rise for three years, falling only during the 2008 financial crisis. This pattern does not indicate that the recent tax changes were of major concern to top-income earners.
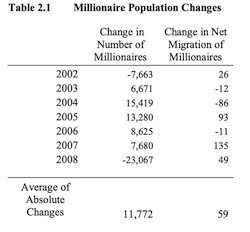
Chart: The population of full-year resident millionaires has ranged from about 42,000 to 93,000, while out-migration has ranged from about 300 to about almost 600. Net migration has ranged from -116 to 150.
Overall: The number of millionaires has gone up or down, on average, by 11,772 people a year. The net migration of millionaires has gone up or down by 59 people. Migration accounts for just one-half of one percent (0.5%) of the changes in the millionaire population.
Takeaway: Some 99.5 percent of fluctuation in the size of the millionaire population is driven by something other than migration – mostly, income dynamics at the top – California residents growing into the millionaire bracket, or falling out of it again.
Millionaire Migration
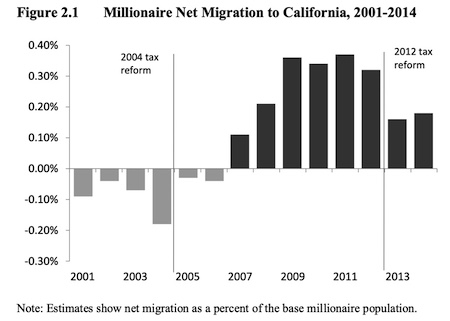
Takeaway: There is not a pattern of millionaire out-migration in recent years despite the 4 percentage point tax increase on income above $1 million since 2004 (rising from a rate of 9.3% to 13.3% in 2012).
Context: There was a small net outflow of millionaires leaving California in the years prior to
the first tax increase, but this outflow decreased in 2005 and 2006, and then shifted to a positive inflow of millionaires to CA in 2007.
One outlier: There is an increase in out-migration patterns when a divorce occurs.
Chart and data: Millionaire Migration in California: Administrative Data for Three Waves of Tax Reform
Another Perspective
The Center on Budget & Policy Priorities found:
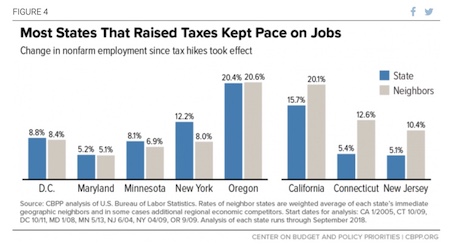
-
Six of the eight states enacting millionaires’ taxes since 2000 had economic growth about as good or better than neighboring states while the tax cuts were in effect. (See Chart here) In four of the eight states (California, the District of Columbia, Maryland, and New York), growth in private-sector gross domestic product (GDP) exceeded other states in the region. Two other states (Minnesota and Oregon) had about the same growth as their neighbors, while in Connecticut and New Jersey, economic growth fell below that of nearby states.
-
Seven of the eight states had per capita income growth as least as good as their neighbors after enacting a millionaires’ tax. California, Minnesota, and New York exceeded their neighbors’ average by at least 5 percentage points, while the District of Columbia, Maryland, New Jersey, and Oregon met or slightly surpassed it. Connecticut fell behind on this measure, as it did on private-sector GDP growth. (See Chart here)
-
Five of the eight states added jobs at least as quickly as their neighbors. New York added jobs at a significantly higher rate than its neighbors; Minnesota slightly exceeded its neighbors; and the District of Columbia, Maryland, and Oregon kept pace with their neighbors. California, despite strong growth in its overall economy, fell slightly below the regional average on jobs due to above-average employment growth in neighboring states such as Arizona and Nevada, though it exceeded the U.S. average. Connecticut and New Jersey trailed behind on job creation after raising tax rates. (See Chart above)
Bigger Changes are Needed to CA’s Tax System
CA’s tax system is still based on an era in which goods, not services, dominated the economy.
Numerous reports have detailed recommendations for a framework relying less on the highly volatile income taxes generated by high income earners and more on a broader based system.
Some of the more recent calls to change CA's tax system have come from State Senate Majority Leader Bob Hertzberg, D-Van Nuys.
In 2008 he presented legislation to reduce middle class income taxes by expanding CA’s modest service taxes to target other high-end services, such as those provided by lawyers, consultants, and accountants for corporations and other high-income businesses.
This would broaden CA’s tax base and rebalance the state’s volatile fiscal formula. Importantly, the impact on businesses subject to the new tax would be minimal because they can continue to deduct these costs on their federal taxes. 49 states tax services, and 43 of those states tax more services than CA does. In Hawaii, for example, there is a four percent tax on legal and accounting services. In New Mexico, large businesses that employ accountants incur a five percent service tax.
Other reports have presented ideas around: simplifying the income tax code, the elimination of credits and deductions, reducing the state's corporate rate, to name a few.
Reports that have focused on tax change recommendations:
- Log in to post comments